FCP LCP CLS and INP The Core Web Vitals ?

So, we know why performance is important, but how do we measure changes? Where do we monitor, and how do we track metrics? Let’s dive into Performance Metrics / Core Web Vitals.
Performance Metrics / Core Web Vitals
Let’s discuss performance optimization, starting with Core Web Vitals. Now, the question is: What are “vitals”?
In the context of the human body, vitals are the critical organs, like the brain, liver, heart, and lungs, that are necessary to maintain life. Similarly, for the web, there are some Core Web Vitals that are crucial for website performance:
- LCP (Largest Contentful Paint)
- FID (First Input Delay)
- CLS (Cumulative Layout Shift)
These metrics help evaluate user experience and are essential for performance monitoring.
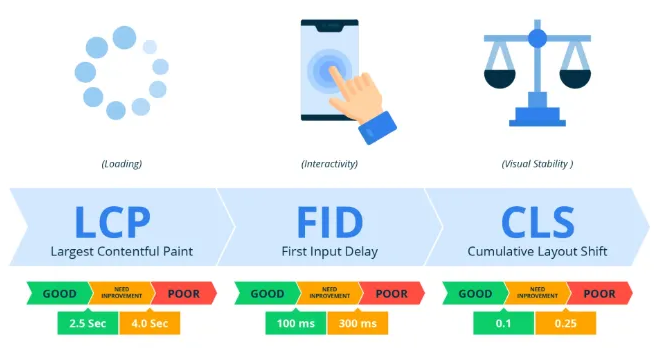
We name it Core Web Vitals because there are multiple web vitals, but these three are the most important. For a web page, the journey is like this: first, it loads; then you interact with it; and finally, you consume the content, which may involve layout changes.
LCP (Largest Contentful Paint)
LCP simply means how much time it took to load the maximum elements of the web page.
For example, as you can see in the above screenshot, if it takes 2.5 seconds to load, it is good. If it takes between 2.5 to 4 seconds, there is a need for improvement. If it takes more than 4 seconds, then there is a serious issue, and the performance is bad.
Official documentation for LCP: LCP Documentation
FID (First Input Delay)
FID measures the time when an element becomes interactive. The delay is counted from the time when the element is loaded until it is interactive.
- Under 100ms is great.
- 100ms to 300ms needs improvement.
- Above 300ms indicates poor performance.
Official documentation for FID: FID Documentation
CLS (Cumulative Layout Shift)
CLS happens after the page loads when elements change their position unexpectedly. It measures the amount of layout shifting that happens and whether it's good or bad for the user experience.
There are formulas and techniques to calculate CLS, which can be seen in the screenshot above. We will discuss this in more detail later.
Official documentation for CLS: CLS Documentation
let`s understand with example
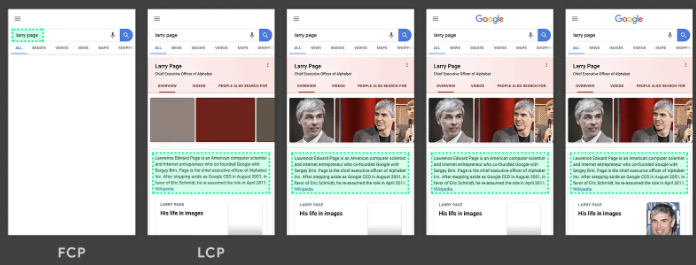
Whatever appears first on the page is called FCP (First Contentful Paint). It measures the time when the first thing appears on the page. Once most of the largest elements of the page are rendered, that’s called LCP (Largest Contentful Paint). As shown in the screenshot above, LCP is when the major content appears.
The second section of the screen shows LCP, and after that, the page may still be rendering elements. You may not be able to interact with buttons or other elements because they are still loading. The time between FCP and when you can interact with the page is called FID (First Input Delay).
Now, when elements are rendered on the page but something appears after that—like a side banner or an additional section—this should happen within a short time, not after several seconds. This is called a layout shift, also known as CLS (Cumulative Layout Shift).
Note: It's important to mention that CLS can occur not just during the initial load but also when users scroll down the page. As new content is added or the layout shifts, CLS continues to happen throughout the user journey until the page is fully loaded and settled.
CLS with Example
Let’s understand CLS better with a screenshot, so we can learn how to handle it properly.
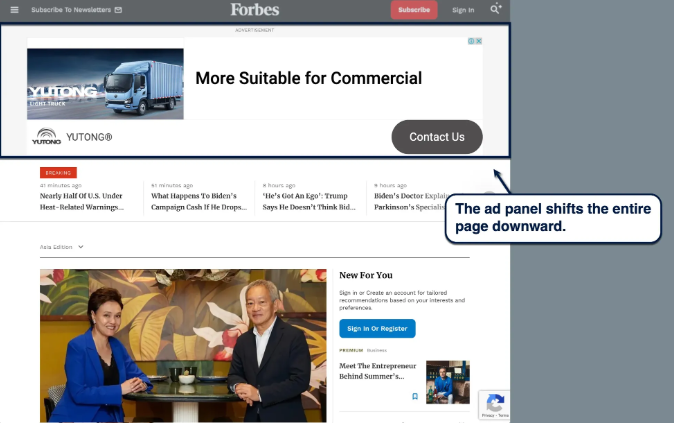
As you can see in the screenshot above, when the page first loads, you get the main content of the webpage. Then, an ad panel appears from the top, causing the previous layout, which started at the top of the page, to shift down. This shift can also happen from the left or right side of the page, depending on the layout.
To better understand CLS and how it happens, let's first get a clear understanding of what it is and how it impacts the user experience.
How to Get the Score of Any Webpage
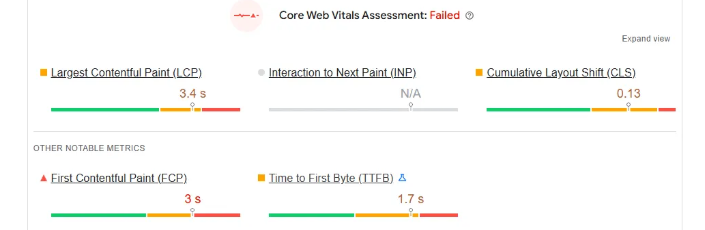
To get the performance score of a webpage, there are multiple tools available, such as PageSpeed Insights, Microsoft Clarity, and Sentry. We will discuss these tools in detail later, including how to improve performance.
When you use these tools, you will see results similar to the screenshot of Google PageSpeed Insights shown above.
Let’s Measure in Real-Time Using Dev Tools
You can go into the Inspect Mode of your website and select the Performance tab, just like you would with the Console or Network tabs. Click the Record button (the rounded button in the top-left corner) and then reload the page using the browser button. After a few seconds (around 5-6 seconds), stop the recording, or it will stop automatically.
In the same tab, you can also go to Lighthouse in Dev Tools to perform the same task and get detailed insights.
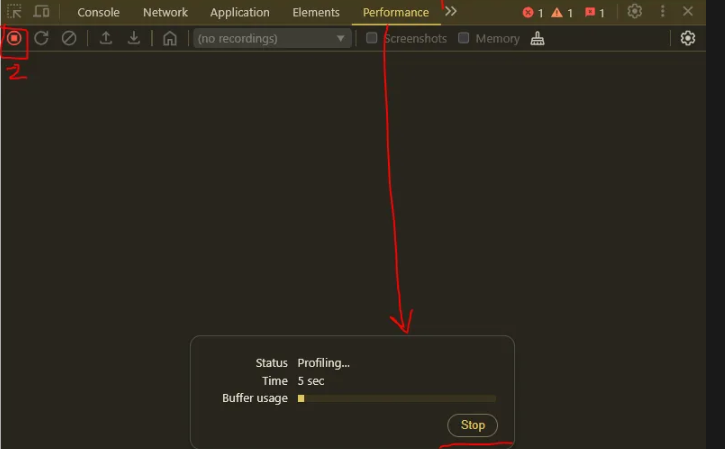
and after stoping it you will see somehtign liek this
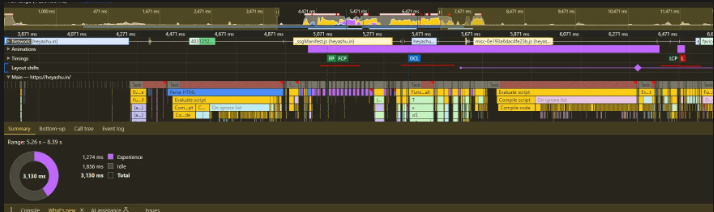
Where you can see FCP, LCP, and others, we will dig deeper properly later.
A New Metric That Is Core Now
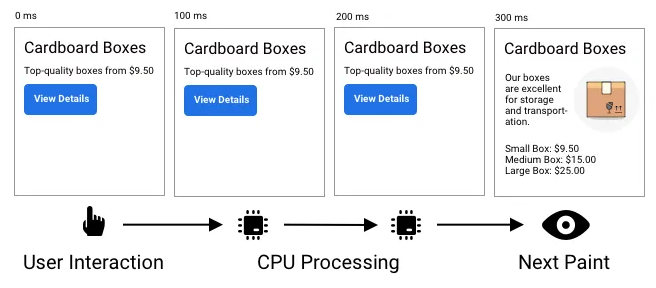
So, we have learned about FID, which is the time when we are able to click on any button for the first time. But as we know, we also interact with our page, and scripts get loaded when we scroll or interact. The Input Delay is also important for other elements that are added to the webpage later after interaction. To measure that, we have INP (Interaction to Next Paint).
INP (Interaction to Next Paint)
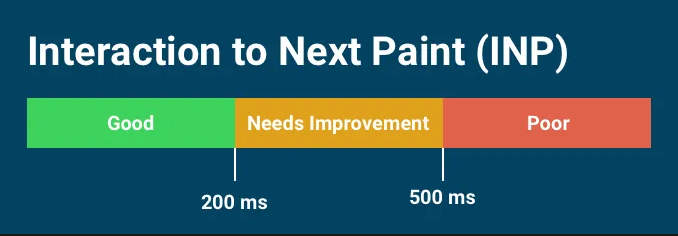
INP (Interaction to Next Paint) is a metric that measures how quickly a website responds to user interactions. It tracks the time it takes for things to load and become interactive. If the response time is within 500ms, it’s okay; otherwise, it’s not good. This metric was introduced in March 2024.
Let’s talk more about it.
There are many metrics, but some are user-centric and related to the user experience, while others are browser-related. As a developer, we should know which metrics relate to which persona.
Browser-Centric Metrics
- TTFB (Time to First Byte): The time it takes to receive the first byte of data from the server to the client browser.
- Network Requests: How many requests are needed to serve the page.
- DNS Resolution: The time it takes to resolve the domain name to an IP address.
- Connection Time: The time taken for the handshake and establishing the connection.
- DOM Content Loaded Time: The time it takes for the DOM to be fully loaded.
- Page Load Event: The event that signals the page has been fully loaded.
User-Centric Metrics
- FCP (First Contentful Paint)
- LCP (Largest Contentful Paint)
- FID (First Input Delay)
- INP (Interaction to Next Paint)
- TBT (Total Blocking Time): The time between FCP and interactivity.
- CLS (Cumulative Layout Shift)
Learn more here: User-Centric Performance Metrics
Other Web Vitals
There are other vitals like TTMFP (Time to Maximum First Paint) and TTI (Time to Interactive) that can be monitored as well.
So that's all for this note. We’ll meet in the next one, where we’ll discuss the tools we can use to measure these metrics in detail.
Take care of your performance and health. Do exercise and stay healthy. See you, bye-bye!
Continue Exploring
COLLECTION
sync, async, setTimeoutZero in Node.js
Continue exploring notes from the digital garden.
COLLECTION
How AI Models Become Assistants: From Pre-Training to Post-Training
Namaste AI Notes Episode 8 — How AI models become assistants: Common Crawl, FineWeb, SFT, instruction tuning, RLHF, reward models & Goodhart’s Law. Free digital notes on heyashu.
Want me to write notes on a course?
Tell me the course, book, or research topic you want covered. If it helps learners, I'll consider adding structured digital notes for it in the garden.
Have a notes collection to feature here?
Do you have open notes you want featured in this digital garden? Let me know — we can collaborate and publish them for learners worldwide.
Having a doubt? Ask a query?